


California Dashboard
overview
overview![]()
overview
California’s new accountability and continuous improvement system provides information about how local educational agencies and schools are meeting the needs of California’s diverse student population based on a concise set of measures. The California Dashboard takes into account 5 different measures when rating a school and its progress.
- Chronic Absenteeism
- Suspension Rates
- English Learner Progress
- Graduation Rates
- College and Career Readiness
- Academic Progress
Results
Results![]()
Results
There are two formats for consuming this information and they are explained below:
California School Dashboard Report
The Dashboard contains reports that display the performance of local educational agencies (LEAs), schools, and student groups on a set of state and local measures to assist in identifying strengths, weaknesses, and areas in need of improvement.

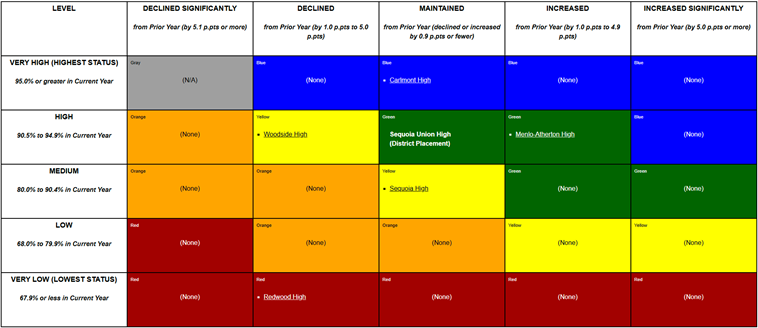
California Model Five-by-Five Grid Placement Reports
California's new accountability and continuous improvement system is based on a five-by-five colored table that produces 25 results using five colors. The reports display the schools' (by district) and student groups' placement on the five-by-five colored table.
Understanding the Dashboard
Understanding the Dashboard![]()
Understanding the Dashboard
suhsd school dashboards by year
suhsd school dashboards by year![]()
suhsd school dashboards by year
- 2023
- On the 2023 California School Dashboard, Sequoia Union High School District received a "not met" on all five local indicators, despite meeting all local indicator requirements, due to an error in submission of the 2022-23 LCAP to the state. The state has allowed for districts, including SUHSD, to post an attachment to its Dashboard page with an overview of its local indicators. SUHSD's attachment can be found below. A "not met" rating on a local indicator does not count against a district for differentiated assistance or any state monitoring.
- SUHSD Attachment to CA School Dashboard 2023
- 2022
- 2021
- 2020
- 2019
- 2018
- 2017
more data resources
more data resources![]()
more data resources
View additional reports on DataQuest, the California Department of Education's public data reporting website.
The SUHSD Dashboard is the District's set of internal indicators that help guide our progress on a more timely basis. The key indicators are enrollment, demographics, attendance, suspensions, A-G completion, AP/IB participation, graduation, ELA & Math SBAC, and college enrollment/completion.
New in the 2023-24 school year, the SUHSD dashboard is now available in an interactive format. The new format allows you to explore dashboard indicators visually with filters that automatically update the data that you see.


